| Headache | Beatles | Stones | U2 |
|---|---|---|---|
| N | 55.77% (29) | 43.75% (21) | 15.00% (9) |
| Y | 44.23% (23) | 56.25% (27) | 85.00% (51) |
SRMP: answers for assignment 1
Part 1/2 (JASP)
Open Assignment1_data. These are (simulated) data from an experiment measuring emotional and nociceptive responses to different types of music. Participants were randomly assigned to one of three conditions (Music): listening to 15 minutes of a selection of music from either the Beatles, the Rolling Stones, or U2. After the listening period, participants were asked if they had a headache (Headache; Yes/No) and they were also asked to rate how nauseuous they felt on a scale of 0-100 (Queasy). The researchers expected that Music (IV) would have an effect on these two DVs. Take a good look at the data file before you begin answering the questions!
- Use an appropriate descriptive/graphical technique to visualize the impact of
Musiccondition onHeadache(include this in your report) and interpret the output. (3 points)- A crosstab (1) with appropriate percentages (1) (i.e., showing distribution of Yes/No responses within IV conditions) should be generated (although points may be awarded for sensible alternatives). A comparison of percentages suggests that participants who listened to U2 reported headaches more frequently than those who listened to the Stones or the Beatles (lowest frequency). (1)
- Use a suitable inferential technique to test the hypothesis. Report the relevant output and offer your conclusions. (3 points)
- A chi-square test (1) shows that there is a statistically significant effect of
MusiconHeadache- \(\chi^2\) (2, N = 160) = 21.28, p < .001 (1) - such that those who listened to U2 more frequently experienced headaches (1).
- A chi-square test (1) shows that there is a statistically significant effect of
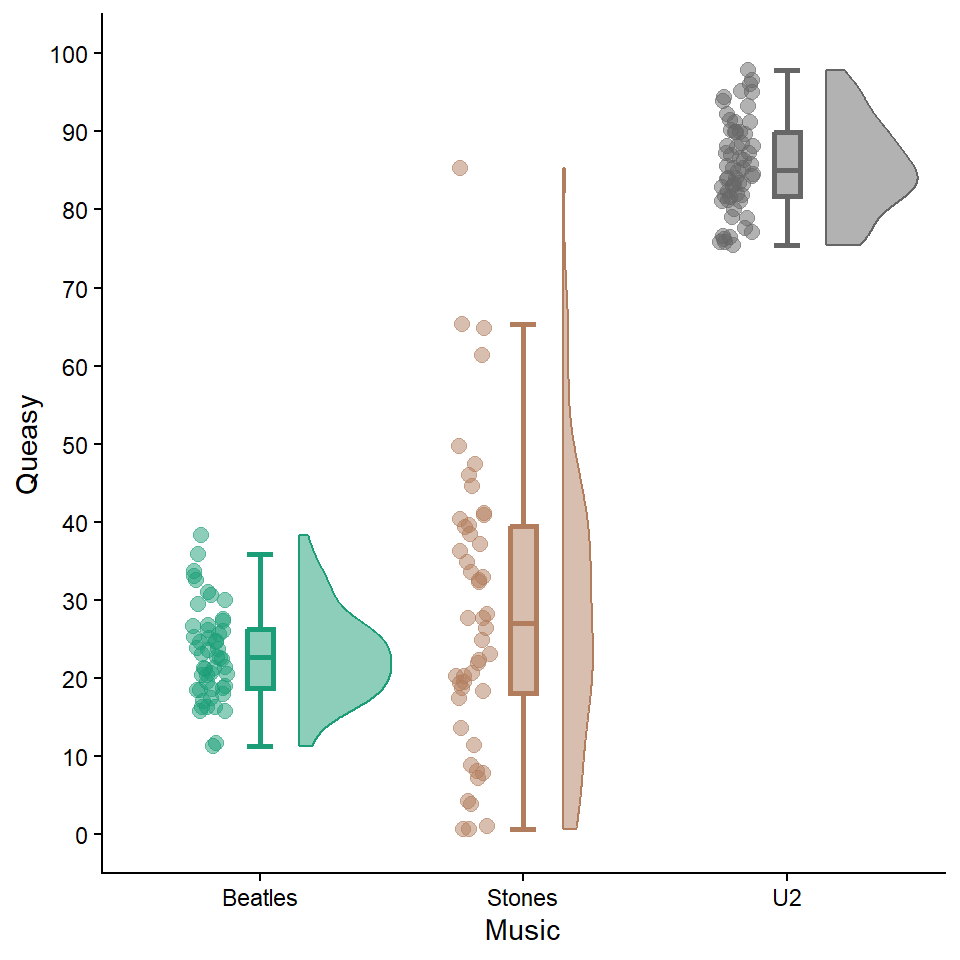
- Now, consider the
Queasydata. Visualize these and give a preliminary interpretation. (3 points)- (1 for nice graph.) Listening to U2 seems to result in the strongest sensation of nausea, followed by listening to the Stones, and then the Beatles (1).The difference between the Beatles and Stones groups is quite small (1).
- Run an appropriate inferential technique, report all relevant output, and offer your conclusions. (4 points)
- A one-way ANOVA (1) revealed a significant effect of
MusiconQueasy: F (2, 157) = 537.67, p < .001 (1). Post-hoc tests showed that the Beatles and Stones groups did not significantly differ from each other, whereas the U2 group recorded significantly higherQueasyscores than both of the other groups (1). We might conclude that listening to 15 minutes of U2 makes one feel more unwell than listening to 15 minutes of either the Beatles or the Rolling Stones (1).
- A one-way ANOVA (1) revealed a significant effect of
Part 2/2 (conceptual)
Dr. Metheny is interested in whether regularly listening to smooth jazz music can reduce exam stress. A week before an exam, he randomly assigns student participants to a nightly listening programme of smooth jazz, or a control condition where they simply follow their established study habits. The dependent variable is the difference between pre-study exam stress and exam stress reported on the morning of the exam, with stress originally measured on a 0 – 100 scale (pre- minus post-, meaning positive difference scores = stress reduction relative to baseline). Metheny finds a significant reduction (p <.05) and reports that listening to smooth jazz music can reduce study stress.
- What is the most obvious problem you can find in Metheny’s conclusion? (2 points)
- ‘Established study habits’ (or, ‘nothing at all’) is a very weak control condition and does not allow for isolation of the specific benefit of smooth jazz. (I.e., the same reduction could have been found in students who added some other kind of regular music/sound listening programme to their study routine.)
- How would you address this problem in a replication study? (2 points)
- If Metheny is interested in the specific benefit of smooth jazz, he could include some musical control conditions (e.g, smooth jazz vs. free jazz/gentle classical) next to the ‘study as usual’ (passive) control condition.