SRMP: answers for assignment 3
Part 1/2 (JASP)
Open the dataset Assignment3_data_part1. Dr. Kater had previously observed that students following certain majors tended to often use pretentious language during discussions about current events with classmates in cafes, especially after a few drinks. He and his team decided to run a study where they invited Fine Art and Politics students (Major) to the lab and randomly assigned them to receive either 2 glasses of a very low alcohol IPA beer, a ‘standard’ IPA of 5% alcoholic volume, or a strong double IPA of 10% volume (Drink). After consuming their drinks, each student was taken to a room where they were told they would join a discussion on current affairs with 3 students from another university who followed the same major as they did - in reality, these were confederates working for Dr. Kater. These confederates each scored the participating students for frequency of pretentious language use (0 = ‘Plain speaker’; 100 = ‘William F. Buckley’) and the scores of the three confederates were averaged to form the DV LanguageScore, which Dr. Kater and his team were keen to compare across conditions.
- Following your own intuition, propose clear and strong hypotheses for the design above (only\(\ H_1\), no need to mention\(\ H_0\)). (3 points)
- 1 point each for clear hypotheses which express a specific difference (i.e., a direction) or pattern of differences (in the case of the interaction).
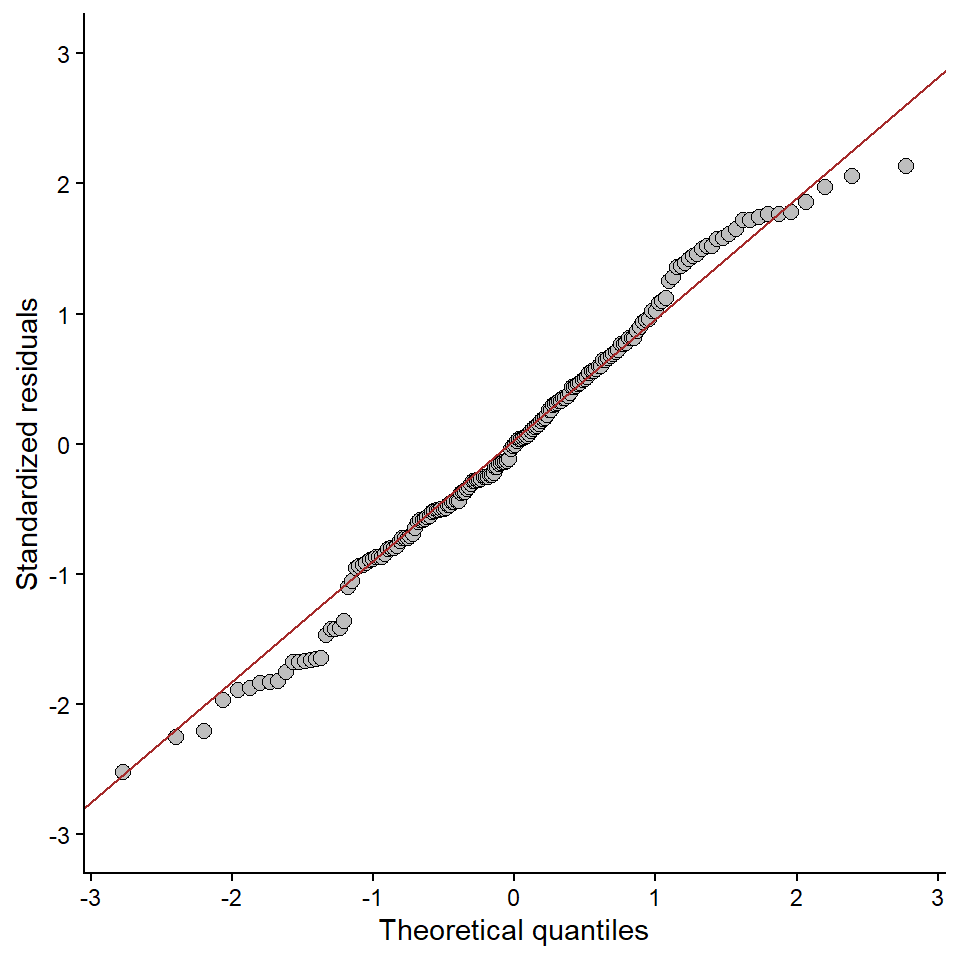
- State the most appropriate test to run on these data. Screen the data and comment on whether the assumptions of the test seem to be met. (4 points)
- Factorial ANOVA (1)
- As can be seen in a QQ plot, the model residuals do not exactly follow a normal distribution (1.5).
- Levene’s test gives p < .05; variances may not be homogeneous (1.5).
- Prepare a graph which visualizes the descriptive results and include this in your assignment document. (2 points)
- Nice graph which shows central tendency and spread (2).
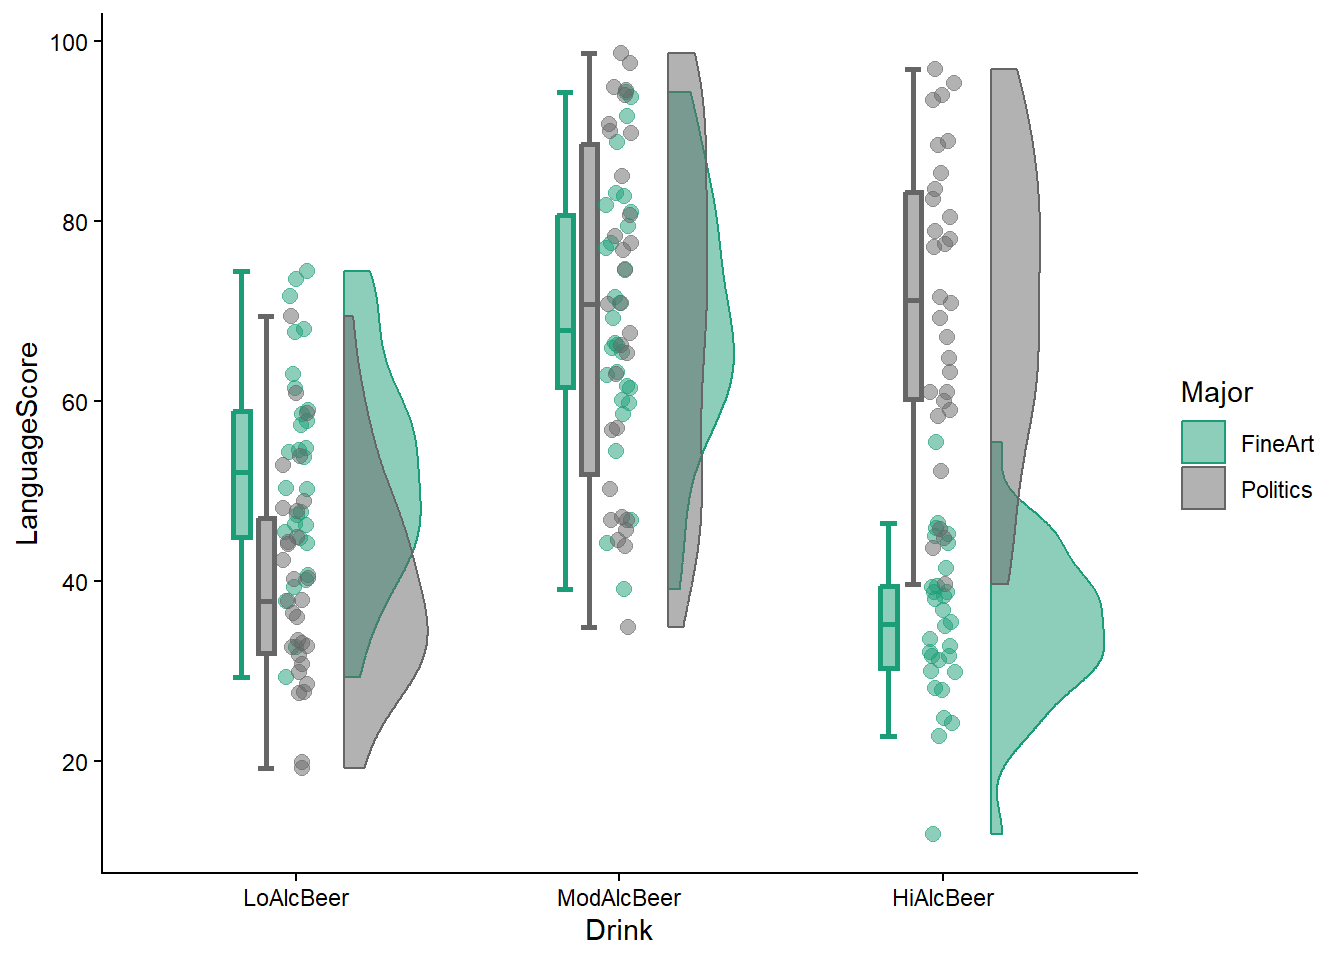
- Regardless of the outcomes of your screening, perform the inferential test you proposed in Q2. What conclusions can you draw with regard to the hypotheses you presented in Q1? Support these conclusions by discussing relevant (descriptive) numerical information and test output (no need to use APA format, just highlight those parts of the output which were crucial to your decision-making). (8 points)
- The main effect of
Majoris significant: on average, Politics students score higher than Fine Art students (1). - The main effect of
Drinkis significant: ‘standard’-strength beer appears to lead to higher scores than the other categories, followed by strong and low-alcohol beers (1). Post-hoc tests were significant for all categories (1). - The interaction effect is significant: fine Art students’ scores increase across ‘low’ to ‘standard’ beer, but drop across ‘standard’ to ‘strong’; whereas Politics students’ scores increase across ‘low’ to ‘standard and then stabilize/do not differ much across ’standard’ to ‘strong’. The score difference between majors is most pronounced in the ‘strong’ conditions (2). Simple-effects/post-hoc testing shows, when breaking down by
Drinkthe difference between the major groups was significant for the ‘low’ and ‘strong’ drinks, but not for the ‘standard’ drinks; and that, when breaking down byMajor, the only non-significant difference was among the Politics students when comparing the ‘standard’ and ‘strong’Drinkconditions (2). - Comments relating these findings to the specific hypotheses formulated in Q1 (1).
- The main effect of
Part 2/2 (JASP)
Open the dataset Assignment3_data_part2. Prof. Vogel has noticed that birds from the corvid family enjoy eating sausage rolls which have been discarded on train station platforms. In her bird lab, she designs a study to test her hypothesis that corvids (regardless of sub-species) will prefer sausage rolls from a producer with a stronger reputation (Albert Heijn) as compared to those from a less reputable producer (Kiosk). The sampled birds were assigned to receive a sausage roll from only one of the two brands and their preferences were studied by measuring how often they pecked at the sausage roll they were offered (Pecks). The age of each bird (Age) was also recorded in the dataset, as Vogel reasons that older birds might peck less at pastries regardless of the producer, and she wishes to control for this.
- State the most appropriate test for taking all of Prof. Vogel’s expectations and concerns into account and report only on whether the assumptions unique to this test are satisfied. (3 points)
- ANCOVA should be selected. (1)
- Independence of covariate and IV appears to be satisfied (no sig. difference in
AgeacrossPastry). (1) - Homogeneity of regression slopes appears to be satisfied (no sig.
Pastry*Ageinteraction). (1)
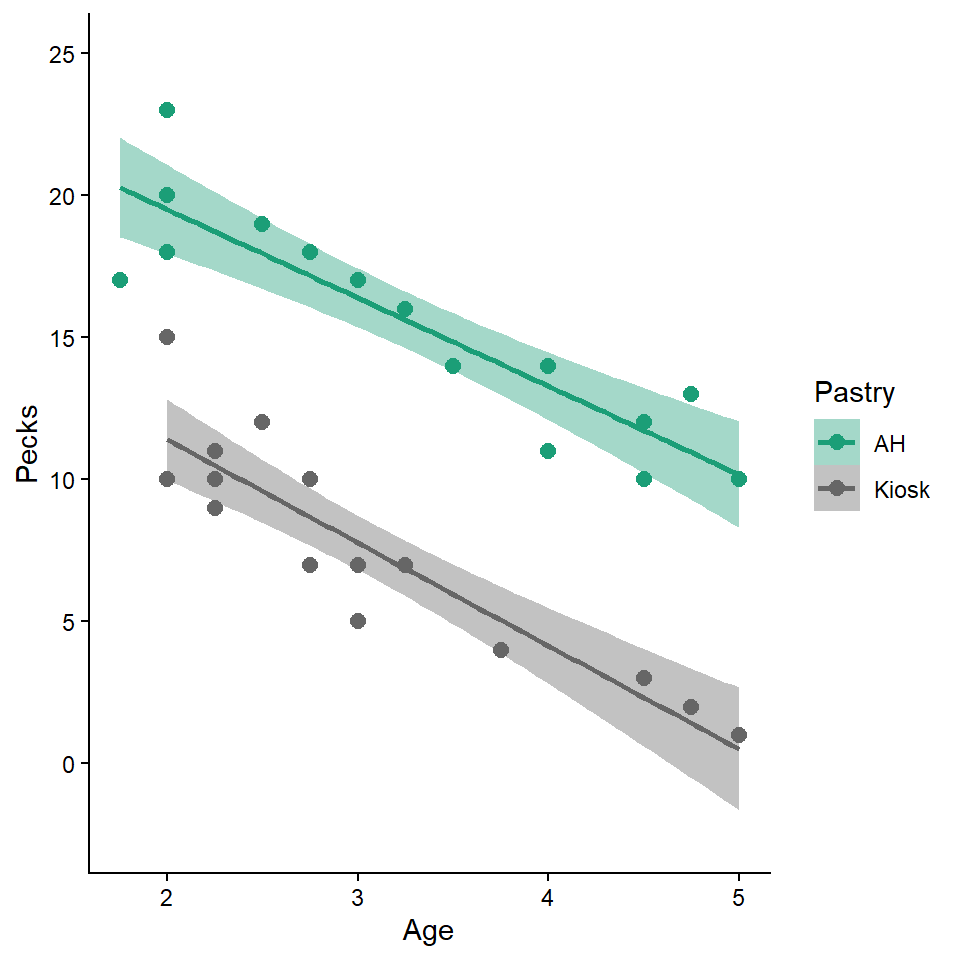
- Run the test (regardless of the outcome of the assumption checks) and - referring to relevant descriptive and inferential output - comment on what the results say about Prof. Vogel’s main hypothesis. (3 points)
- There was a significant effect of
Pastry, adjusted forAge(p < 0.001) (1). On average, when adjusting for age, birds pecked more at the Albert Heijn sausage rolls (mean pecks = 15.47; adjusted mean = 15.86) than those from Kiosk (mean pecks = 7.53; adjusted mean = 7.14). (1 for clear text, 1 for key descriptives)
- There was a significant effect of
- What do the results have to say about her expectations regarding age of the bird? (2 point)
Agehad a significant, negative effect on pecking (1); older birds pecked less overall, as Vogel expected. (1)