SRMP: answers for assignment 5
Part 1/2 (JASP)
Open the dataset Assignment5_data. These are based on real data (Bernard et al., 2012), referenced by Field (2017) where the researchers examined whether presenting sexualized portrayals of women led to those women being objectified. The study was based on the inversion effect – people find it more difficult to accurately recognize pictures which have been inverted (as compared to images presented the correct way up), but this effect is more pronounced for pictures of humans than for pictures of objects. The researchers presented groups of women and men (Gender) with sexualized pictures of women and men; half of these pictures were presented upright, and the other half were inverted. On each trial, the participants were presented with one picture, and were subsequently asked to choose the picture they had just seen from a line-up of two images on a new screen. The main DV was the proportion of correctly-recognized pictures.
Imagine that the researchers hypothesized that, if sexualized images of women are processed as objects, then an inversion effect (i.e., a reduction in recognition scores for inverted vs. upright pictures) should NOT be present for images of females, but it should be for images of males (assuming that images of males are not objectified to the same degree as images of females). Let us also imagine that there is no specific hypothesis for the effect of participant gender (Gender).
- Formulate a hypothesis (only \(\ H_1\)) for the effect of participant gender
Gender, in light of the hypotheses already presented. Give a very brief explanation for your expectation. (3 points)- Hypothesis which follows the hint and makes a clear expectation regarding the three-way interaction (2); possible partial points available for hypotheses only relating to one of the two-way interactions, but no points for a main effect hypothesis (unless a very convincing reason is given for the expectation of overall gender differences in recognition scores); (1) for sensible explanation.
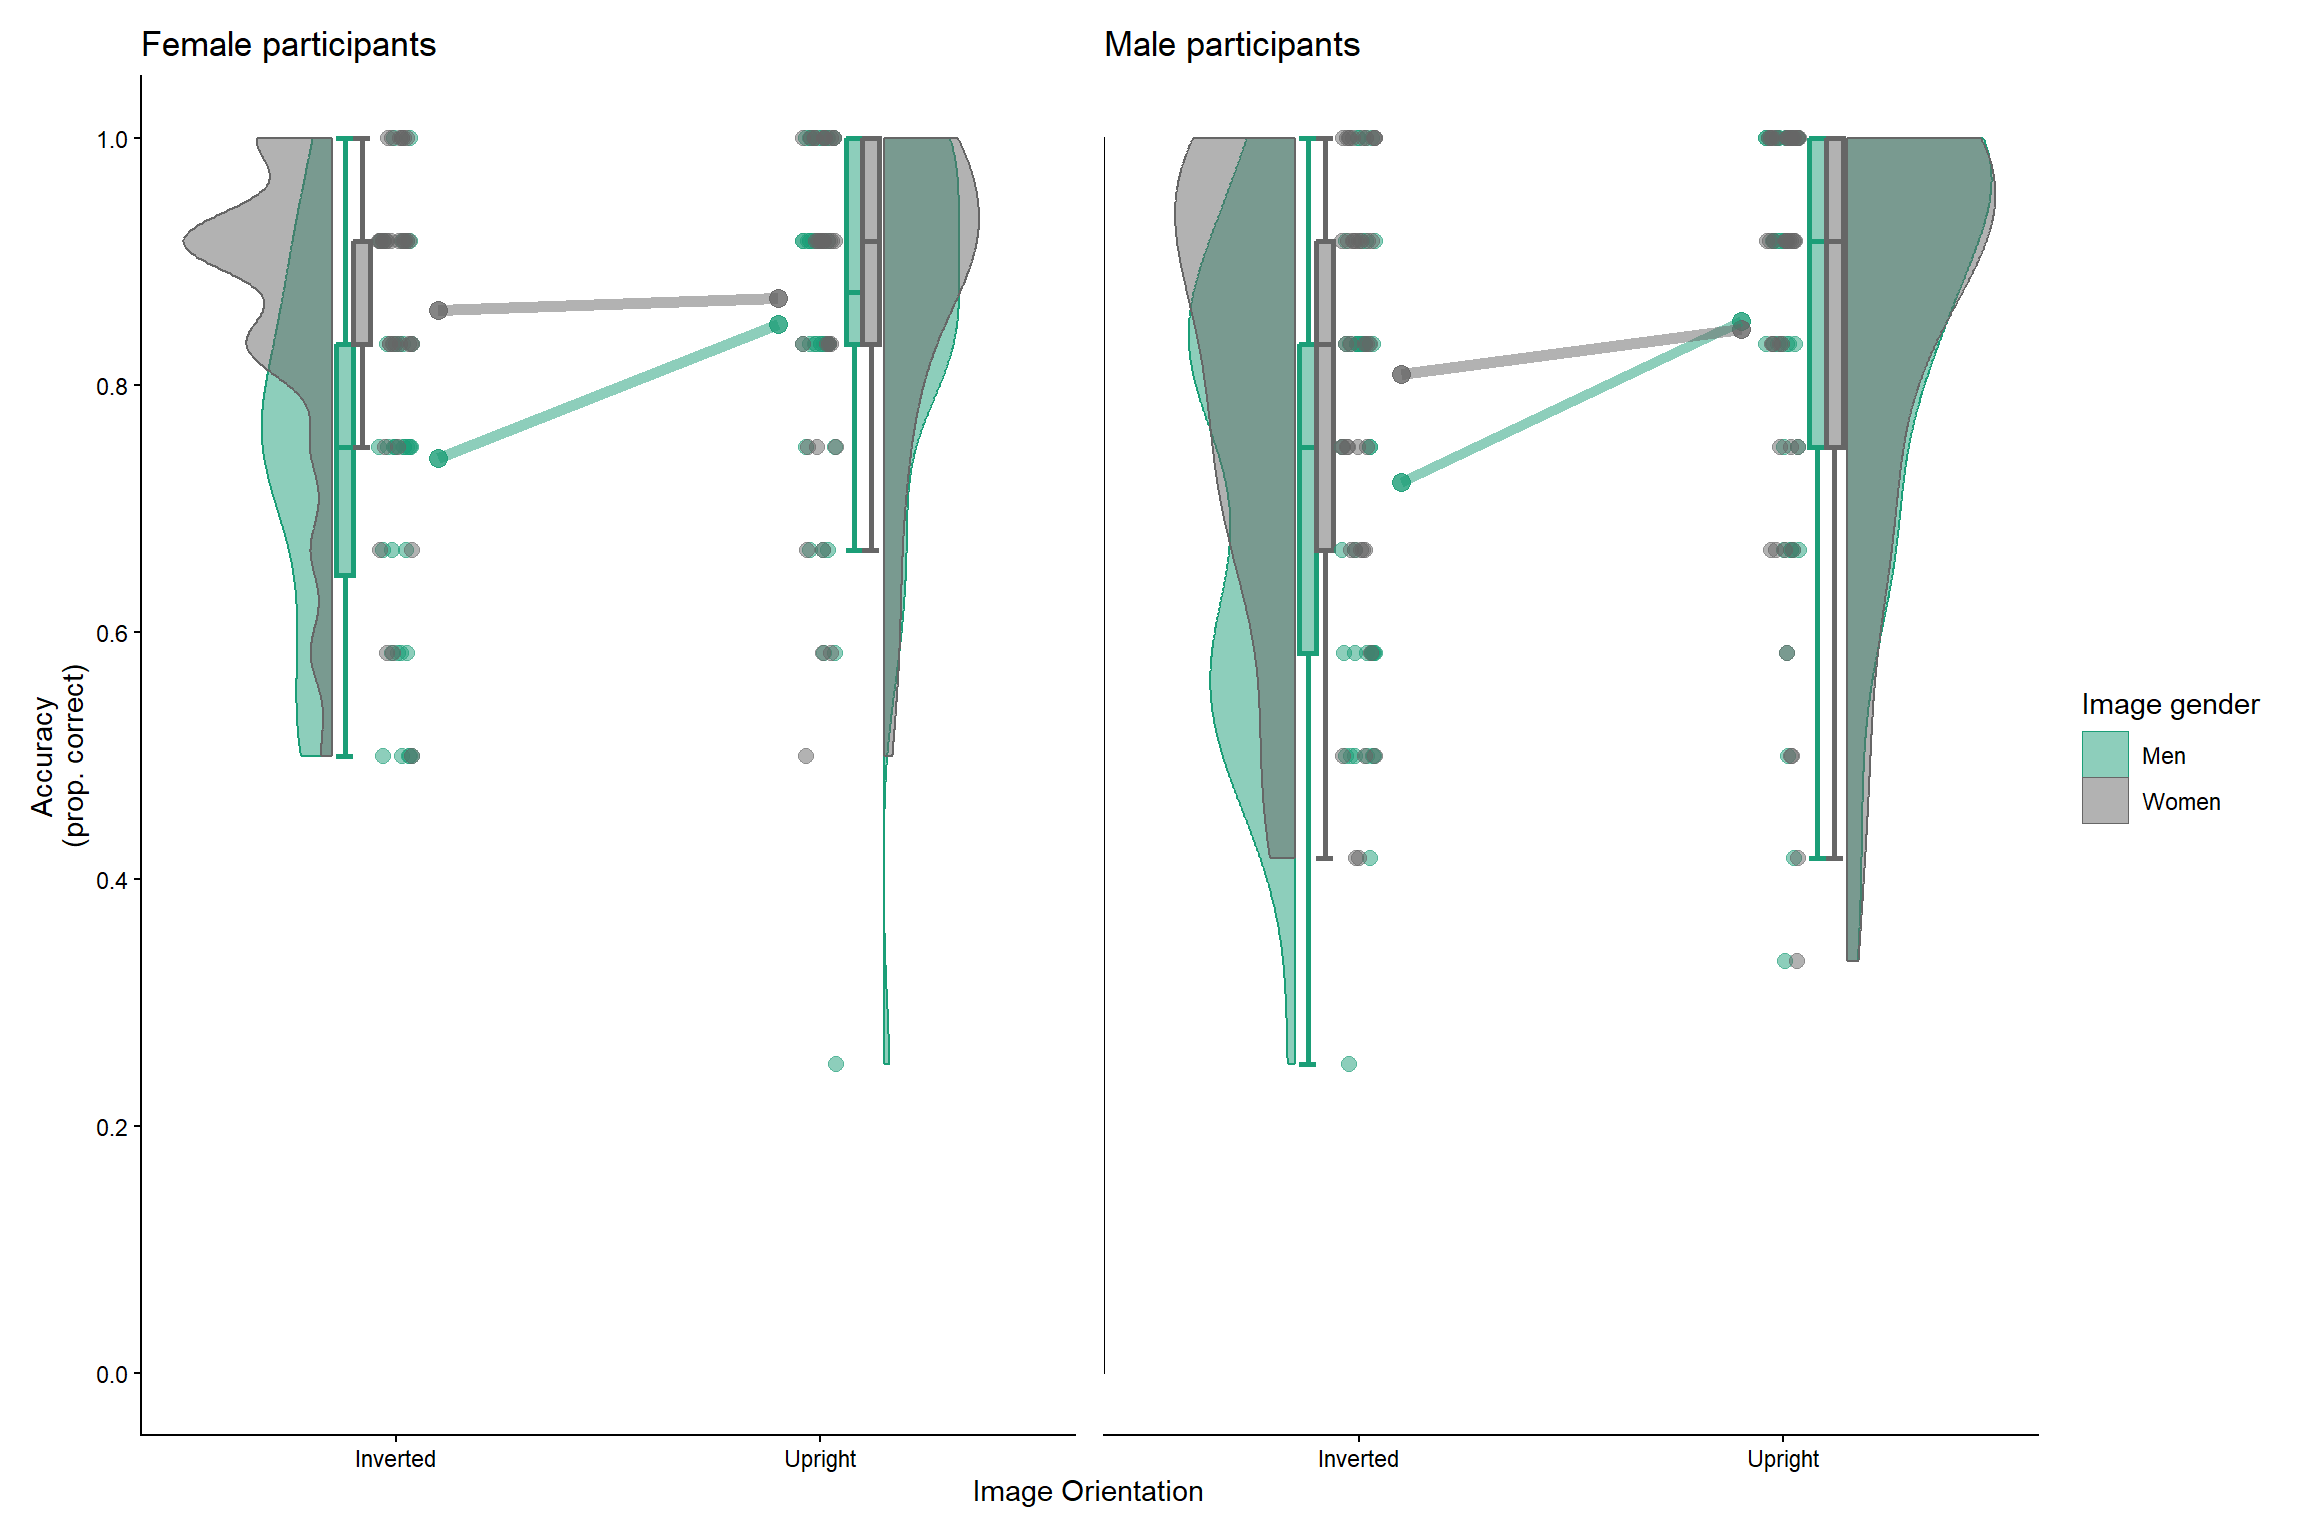
- Visualize the data using a graph appropriate for the design and paste this into your submission. (3 points)
- Points for a neat plot or plots - multiple plots are fine here, as we are dealing with three factors - (1) showing means (1) and dispersion (1) for all conditions (e.g., barplot/lineplot with errorbars, or boxplot).
- State the most appropriate test to run on these data. Run this test, and interpret all relevant output, with reference to relevant supporting descriptive statistics. (11 points)
- Mixed three-way ANOVA should be selected (2 * 2 * 2). (1)
- Significant main effect of inversion (1): overall, recognition scores were higher for upright as compared to inverted images (1).
- Significant main effect of gender portrayed in photo (1): overall, recognition scores were higher for images depicting females (1).
- No significant main effect of participant gender (
Gender) (1). - Significant two-way interaction of inversion and gender portrayed in photo (1): there was a significant inversion effect - reduced recognition scores for inverted vs. upright images - only for images depicting males. (1)
- No other significant interactions (3).
- Give a brief, plain conclusion with respect to the hypotheses (including the one you stated yourself in Q3). (3 points)
- The results reflect the hypothesized inversion effect: inverting images had no impact on recognition of female models, suggesting a higher degree of objectification for these (2). This pattern held regardless of the gender of the participant (1).
Part 2/2 (Conceptual)
We return to Dr. Metheny’s ‘smooth jazz’ experiments from a previous assignment. Metheny was interested in whether regularly listening to smooth jazz music can reduce exam stress, so, one week before an exam, he randomly assigned student participants either to a condition where they followed a nightly listening programme of smooth jazz, or a control condition where they listened to pop music (n = 25 in each group). The dependent variable was the difference between exam stress measured one week before the exam and exam stress reported on the morning of the exam, with stress originally measured on a 0 – 100 scale (pre- minus post-, meaning positive difference scores = stress reduction relative to baseline). Metheny found a mean difference score of 5.32 in the control condition, and a mean difference score of 7.14 in the smooth jazz condition. The pooled standard deviation for each group’s difference score was approximately 2.5.
- Calculate an appropriate measure of effect size for the difference between ‘smooth jazz’ and ‘pop music’ and comment on the strength of the effect. (2 points)
- \(d = \frac{\overline{X_1} - \overline{X_2}}{SD} = .73\) (1); we could classify this as a ‘medium/moderate’ effect.(1)
- How confident are you in this estimate of the strength of the effect? Explain your reasoning. (2 points)
- We should not be too confident in this estimate of the effect (1), because moderate/large effects occurring in small samples are often unreliable and could represent sampling error. (1)
References
Bernard, P., Gervais, S. J., Allen, J., Campomizzi, S., & Klein, O. (2012). Integrating sexual objectification with object versus person recognition: The sexualized-body-inversion hypothesis. Psychological Science, 23(5), 469–471. https://doi.org/10.1177/0956797611434748
Field, A. P. (2017). Discovering Statistics Using IBM SPSS Statistics. SAGE Publications.